We all have heard that often-repeated quote from Mark Twain, “October: This is one of the peculiarly dangerous months to speculate in stocks. The others are July, January, September, April, November, May, March, June, December, August and February.”
You get his point… even though the U.S. stock market has been a profitable place to invest your money for the long term, it’s always risky on a short-term, month-to-month basis. Think of the 21% intramonth correction in December of 2018 before the S&P 500 went on to higher highs and a 31% gain in 2019. Or the 35% intramonth swoon in March of 2020 quickly followed by a 90% surge off the March bottom through the end of 2020.
Interestingly, this past September fulfilled its historical reputation of being the absolute worst calendar month for stock returns as the S&P 500 fell almost 10% in the 30 days ended September 30.1 On the other hand, we are happy to report that October 2022 was an exceptionally good month in the market, with the S&P 500 surging almost 9%,2 quite uncharacteristic for this often difficult month for stock returns. This October seemingly turned a blind eye to October’s tendency to raise investors’ heart rates via various “Black Monday” flash crashes such as those witnessed on October 19, 1987, and October 28, 1929, when the stock market fell 22%3 and 13%4, respectively, in one day alone on those two occasions.
Where Do We Go From Here? Midterms Considered
Of course, the question that everyone is asking us at present is: Will this October rally last through year-end and beyond or was it just a head fake?
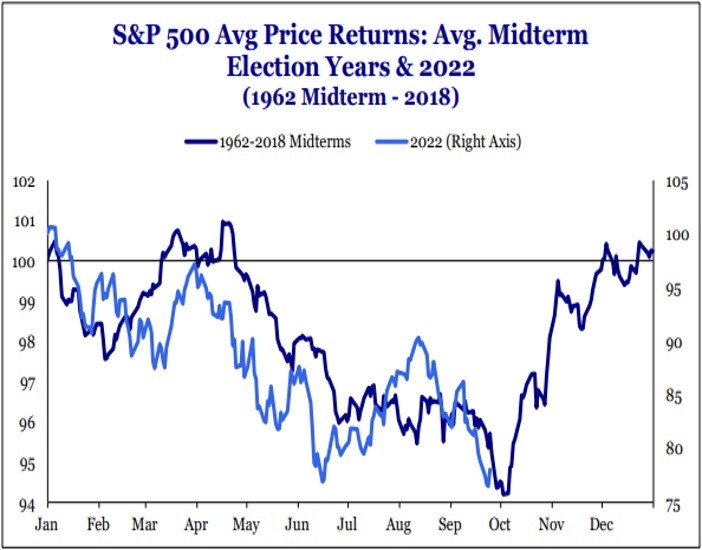
In answering this question, one of the factors to consider is seasonal tendencies in market returns. In terms of seasonality, calendar effects are now shifting from a headwind to tailwind. The S&P 500 chart shows that the S&P 500 normally trades down in a midterm election year such as 2022, from January through the September/October period, and then rallies handsomely in the final two months of the year after we get the political angst and uncertainty out of our systems. So far in 2022, the S&P 500 is right on target with this historical trading pattern, as you see in the chart.

Source: Stategas
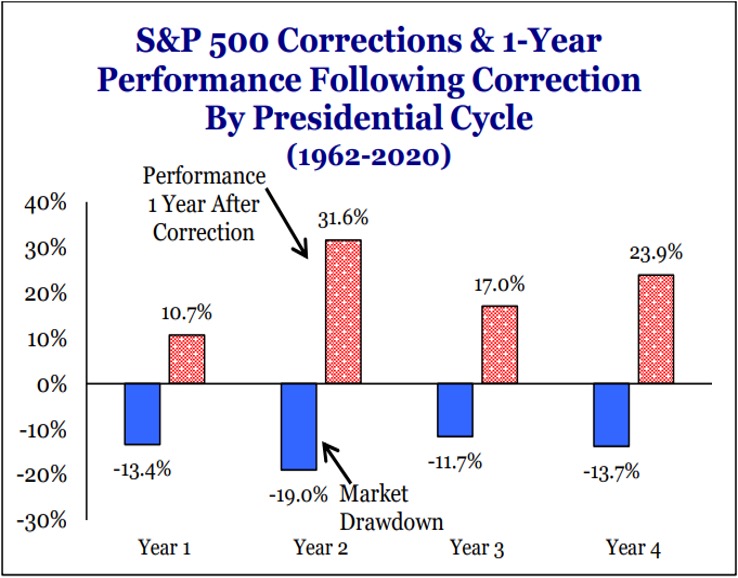
The second bar chart goes into a bit more detail about this observed historical pattern in returns around elections. It shows that an average intrayear, peak-to-trough correction in a midterm election year of 19%, based on data going back to 1962, is more severe than during any other year of the four-year election cycle. So, this tendency for the market to correct by a greater amount in midterm election years is consistent with what we are witnessing this year. At this writing, the market has declined roughly 19% from the early January 2022 peak and by 25% at its lowest point back in mid-October of this year.

Source: Stategas
Additional data in the bar chart is promising and something to think about. It illustrates that the average return in the 12 months following a midterm election since 1962 has always been positive, with an average return of more than 30% in the S&P 500 during this 12-month period. Someone might say, “Jeff, that’s like making the statement that when an AFC team wins the Super Bowl, a bear market follows, and that a bull market results when an NFC team takes the trophy!” While the numbers do support this so-called Super Bowl effect, clearly, there’s no cause and effect. It’s just happenstance.
That’s not the case in looking at stock market returns around the election cycle. There are more than coincidental numbers involved here. There is rationale to this observed positive post-midterm effect. The logic is as follows: In the first year of an election cycle, the incoming president generally tries to implement the key programs on his agenda that he believes are right… may have quite a bit of “spinach” baked into them that folks/investors just may not like—at least right away. This causes angst and uncertainty in the markets. In year two, the Federal Reserve many times adjusts monetary policy to complement policy or in reaction to some of the year one government policy that has an intended or unintended impact on the economy and financial markets. In year three, the president is thinking about reelection. In the final and fourth year of the term, the president is more apt to pursue policy and rhetoric that has “sugar” involved or that is more favorable to the U.S. economy (think of President Biden’s student loan forgiveness program or President Trump’s announcements to back off imposition of tariffs in 2019). The Fed has done most of its work already, so it tends to be more passive/less harmful in policy in the months around the midterm election and in year three as well. Hence, the market tends to rally and perform well in a more favorable, less onerous policy environment in the 12 months following the midterm election. Now, we are not predicting a 30% return over the next 12 months as the chart suggests, but we do recognize that this election effect may shift from a negative to a positive following the election and that this, coupled with what we expect to be better news on the inflation/interest rate front, could lead to positive returns over the next year.
Related Question—Have We Bottomed?
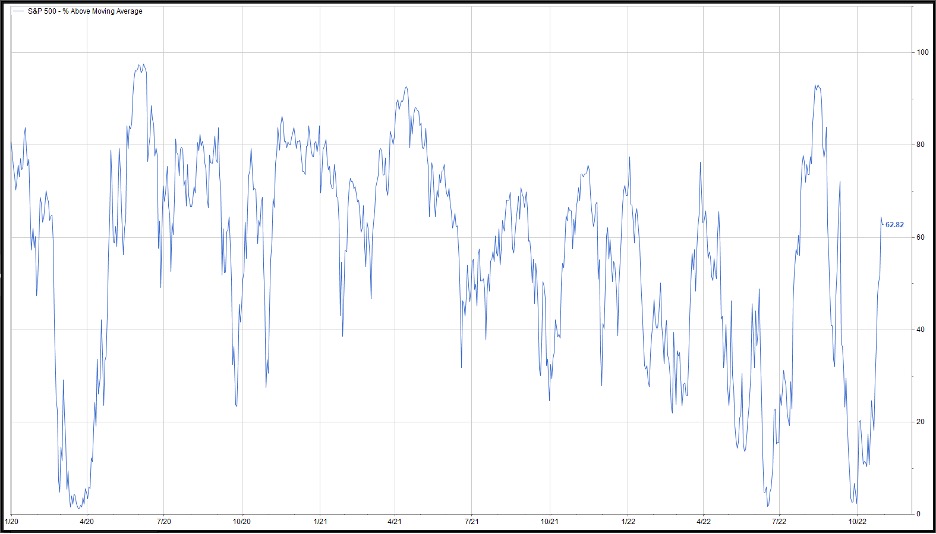
A related and very popular question we are getting is “Have we bottomed?” We see signs that the market is trying to bottom, much like we saw in the rally that lasted from June 16 to August 16 but fizzled. Like then, we see leadership shifting from primarily defensive areas such as energy, utilities and staples to the more risk-on areas such as industrials and financials. Other examples include small-cap stocks beginning to outperform large-cap stocks. As contrarian indicators and additional signs of a potential bottom emerge, investor sentiment is about as bearish or negative as it gets. This is a positive sign, because it could mean there is plenty of cash on the sidelines to come into stocks and support an advance in stock prices. Plus, the market looks oversold in looking at the very low percentage of stocks trading above their 50-day moving average. This figure is close to the low levels we saw back in spring 2020 before the market bottomed and ran hard through the end of the 2020 calendar year.
S&P 500 – % Above Moving Average

Source: FactSet
That said, we are still cautious and maintain our “hold your ground” message. Don’t sell more, but don’t buy on the dips yet, either. The summer rally fizzled in mid-August, and we retested these lows in mid-October, because investors saw some headline inflation news that was disappointing and started to fear once again that the Fed may have to hike rates higher than feared. Since then, we have received some favorable inflation data that shows perhaps it is calming as a result of the work the Fed had already done and that they may be able to pause in 2023 at around 4.5% after these next two hikes in November and December. Fed rhetoric from certain governors, such as Jim Bullard of the Federal Reserve Bank of St. Louis, seems to support this evolving line of thinking at the Fed. Our biggest concern is not recession. We believe the market has already discounted a normal recession via its peak-to-trough decline of 25% this year. In our opinion, this is baked in, so any less-worse inflation news that allows the Fed to pause should inspire a market bottom and a sustainable advance in stock prices.
Our main concern (and the reason why we preach patience and suggest it is premature to add to stock allocations at present) is how high interest rates rise. At present, the bond market seems to be saying that it believes the Fed will stop at 4.5% and pause for a bit, per the levels of the 10-year and 30-year bond and the fed funds futures curve. We want to see some additional inflation data and evidence both from the bond market and the Fed that their peak targets will not move to overly restrictive levels. If rates are trending and look to move to overly restrictive levels, this would likely cause a severe recession rather than a mild-to-normal one that we expect and one that the market has already anticipated.
What To Do/Wrap-Up
We continue to encourage clients to follow the tongue-in-cheek wisdom of the late Jack Bogle of Vanguard fame regarding strategy around periods of market transition and elevated volatility, “Don’t just do something, stand there.” Patience is key right now. Patience not to sell further and patience not to buy on a pullback yet either… hang out at your normal stock allocation. We do sense that we are closer to the bottom and perhaps the bottom is in. The normal allocation should work well for clients if indeed we have hit the trough point as well as if we haven’t quite yet.
If you are an aggressive investor and are not discouraged by modest additional downside, fine, you could add to your stock allocation or accelerate your dollar-cost averaging plan. However, if you are the typical balanced investor who: 1) feels they have suffered enough with this 20%-ish swoon so far this year and 2) does not want to suffer more potential downside should stickier-than-expected inflation and interest rate data take us there… do nothing on the allocation front.
Within our stock holdings in our internally managed strategies, we are focusing on high-quality stocks with strong balance sheets and business models that we believe can perform well in challenging environments. We are also blending both growth and value as we see leadership rotate between the two in this uncertain period. In terms of our bias in market direction in the next 12 months, it is expressed in our investment conversations and incremental trading decisions. We have maintained a defensive tilt. That said, we have added and want to remain aware of risk-on-oriented opportunities that tend to perform well in a bull market recovery that we expect to ensue as we move on into 2023.
Sources:
1,2,3 FactSet
4 Federal Reserve History, Stock Market Crash of 1929
Disclosures:
The S&P 500 Index is a market-value weighted index provided by Standard & Poor’s and is comprised of 500 companies chosen for market size and industry group representation. The index is unmanaged and cannot be directly into. Past performance does not guarantee future results. Investing involves risk and the potential to lose principal.
This commentary is limited to the dissemination of general information pertaining to Mariner Platform Solutions investment advisory services and general economic market conditions. The views expressed are for commentary purposes only and do not take into account any individual personal, financial, or tax considerations. As such, the information contained herein is not intended to be personal legal, investment or tax advice or a solicitation to buy or sell any security or engage in a particular investment strategy. Nothing herein should be relied upon as such, and there is no guarantee that any claims made will come to pass. Any opinions and forecasts contained herein are based on information and sources of information deemed to be reliable, but Mariner Platform Solutions does not warrant the accuracy of the information that this opinion and forecast is based upon. You should note that the materials are provided “as is” without any express or implied warranties. Opinions expressed are subject to change without notice and are not intended as investment advice or to predict future performance. Consult your financial professional before making any investment decision.
Investment advisory services are provided through Mariner Platform Solutions, LLC (“MPS”). MPS is an investment adviser registered with the SEC, headquartered in Overland Park, Kansas. Registration of an investment advisor does not imply a certain level of skill or training. MPS is in compliance with the current notice filing requirements imposed upon registered investment advisers by those states in which MPS transacts business and maintains clients. MPS is either notice filed or qualifies for an exemption or exclusion from notice filing requirements in those states. Any subsequent, direct communication by MPS with a prospective client shall be conducted by a representative that is either registered or qualifies for an exemption or exclusion from registration in the state where the prospective client resides. For additional information about MPS, including fees and services, please contact MPS or refer to the Investment Adviser Public Disclosure website (www.adviserinfo.sec.gov). Please read the disclosure statement carefully before you invest or send money.
Investment Adviser Representatives (“IARs”) are independent contractors of MPS and generally maintain or affiliate with a separate business entity through which they market their services. The separate business entity is not owned, controlled by, or affiliated with MPS and is not registered with the SEC. Please refer to the disclosure statement of MPS for additional information.


